
Re:Think Investment Breadth

Breadth of Typical Permitted Assets for Insurers
According to a recent report by the National Association of Insurance Commissioners, U.S. insurers’ reported cash and invested assets, including affiliated and unaffiliated investments, have steadily increased since at least 2010. The industry has experienced a compound annual growth rate (CAGR) of 3.4% in cash and invested assets from 2010 through 2018, with year-end 2018 cash and invested assets over $6.5 trillion.
The U.S. insurance industry’s asset allocations have been relatively stable and have not changed significantly for many years. Bonds remained the largest component of U.S. insurer assets at year-end 2018, representing 65.7% of total cash and invested assets. Common stock investments were the second largest holding for the industry at 12% of total cash and invested assets, followed by mortgages at 8.5% and Schedule BA assets (other long-term investments) at 5.6%. (See Table 1 below.)
However, given the prolonged low interest rate environment, U.S. insurers have been investing more of their dollars in higher yielding assets, such as mortgages, private equity, hedge funds and privately placed bonds.
It is important for insurers to recognize the breadth of typical permitted asset, the purpose of these various assets, and their role in order to understand if they should be used in a particular portfolio.

Fixed Income
Bonds generally represent the vast majority of investment holdings on insurer’s balance sheets; they are generally there to support the liabilities of the organization. At Miles Capital, we believe that fixed-income investments should not only preserve capital, but also provide liquidity and deliver a yield advantage over the relevant benchmark, whether that’s income-oriented or total return.
The ranking of bond types at year-end 2018 remained consistent with prior years. Corporate bonds and municipals bonds were the two largest bond types, representing 54.6% and 12.1%, respectively, of the industry’s total bond exposure. (See Table 2 below.)
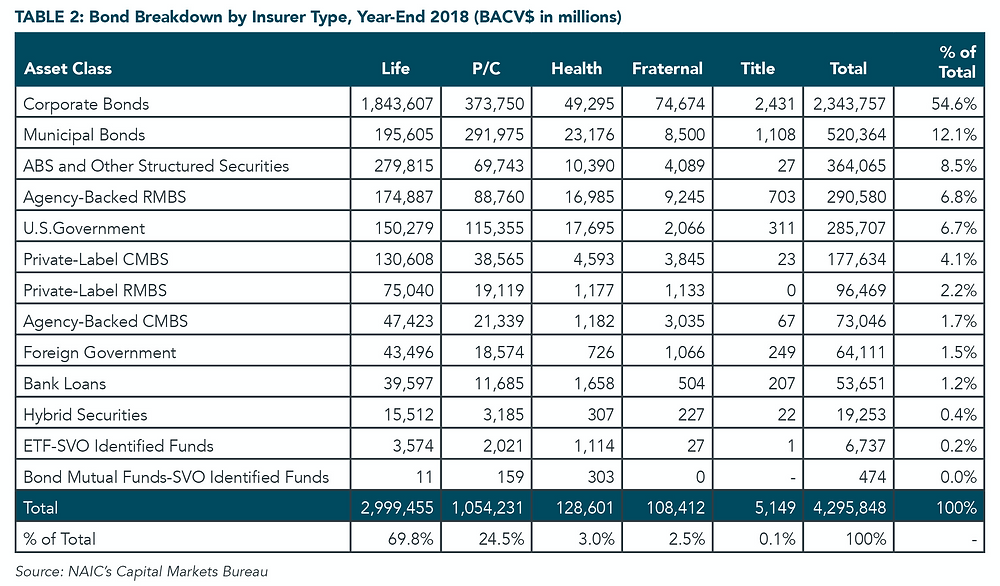
Asset-backed securities (ABS) and other structured securities, agency-backed residential mortgage-backed securities (RMBS) and U.S. government bonds followed and accounted for 8.5%, 6.8% and 6.7% of total bond exposure, respectively.
When it comes to fixed income strategy, some investors are familiar with the simplest approach: buying bonds and holding until maturity. Using this strategy, the investor’s return is approximately the average yield of the bonds in the portfolio. But over time it can be easy to become complacent with the risks inherent in bonds, especially given the solid returns from investment grade fixed income since the global financial crisis of 2007-2008.
Investors must pay careful attention to interest rate risk and credit risk. As we are late in the economic cycle, there is potential for these risks to manifest themselves. Having a robust credit research process to fully review each corporate or municipal issuer, or a mortgage team to review the quality of structured securities is imperative to help prevent value from eroding.
Equity
Common stock investments were the second largest holding for the insurance industry at 12% of total cash and invested assets. That number is heavily skewed by life insurers which typically have lower allocations. Property and Casualty industry allocations are generally higher, from 15-30 percent depending upon surplus strength and other factors. In a well-constructed insurance investment portfolio, equity can support growth, maintain liquidity, and provide market-like upside with less-than-market downside. The foundation for achieving consistent equity performance is built by diversifying critical risks and selecting securities with strong fundamental characteristics.
Determining appropriate allocation to equity markets is of paramount importance. The insurer will need an asset allocation strategy that fully aligns the portfolio with key business objectives and applies a consistent, risk managed approach.
Active equity can provide additional benefits for insurers, including more holistic gain and loss or tax management and the opportunity for downside risk mitigation.
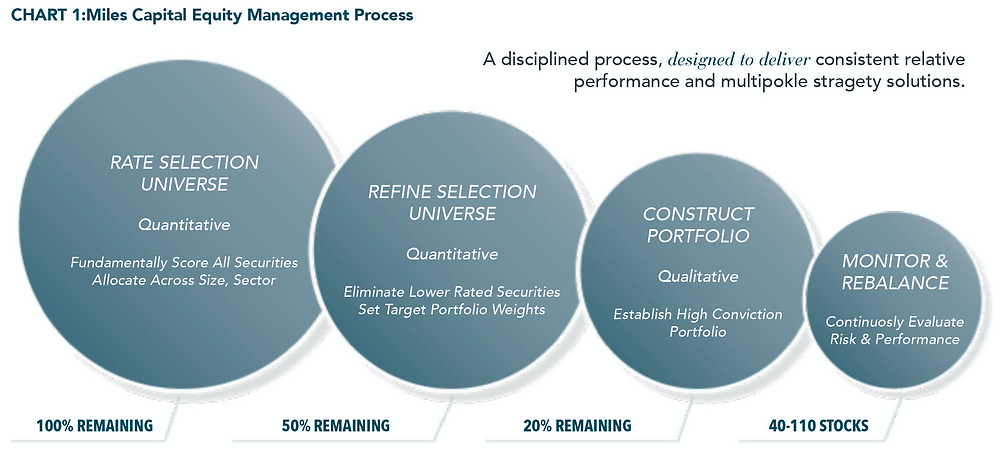
At Miles Capital, our multi-step process (in Chart 1 below) begins by leveraging quantitative tools to rate over 3,000 equities across nine different markets, narrow the universe for fundamental analysis, then relies on our proprietary fundamental security-scoring methodology to ensure we select our highest-conviction stocks. Next we diversify across region, sector and market capitalization to minimize unintended risks, and finally we maintain a strong and ongoing focus on risk management.
Mortgages
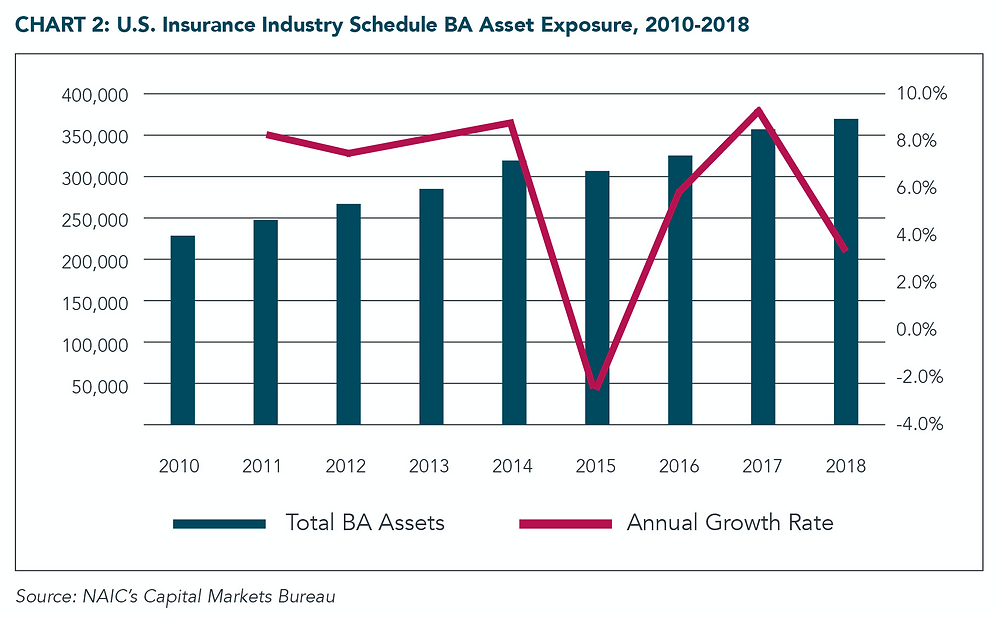
The U.S. insurance industry’s exposure to mortgages increased to $555 billion at year-end 2018 from $322 billion at year-end 2010, for a CAGR of 7.1%. (See Chart 2.) The rate of growth of mortgage exposure for the eight-year period is approximately double that of the industry’s cash and invested assets. For the last three years, the annual growth in mortgage exposure has been at or near double-digits—9.5%, 9.1% and 10.7% in 2018, 2017 and 2016, respectively.
Alternatives
Alternative assets or Schedule BA assets may support growth, help reduce volatility, and potentially provide a hedge to inflation. The NAIC also noted a steady increase in BACV over time for Schedule BA assets. Schedule BA investments include private equity and hedge funds, mineral rights, natural resources, surplus notes, secured and unsecured loans to corporations and individuals, and housing tax credits.
Schedule BA exposure increased to $365.2 billion at year-end 2018 from $228 billion at year-end 2010, for a CAGR of 6.1%. (See Chart 2 below.) The industry’s exposure to Schedule BA assets grew faster than the 3.4% CAGR of total cash and invested assets over the eight-year period, although growth slowed in 2018 to 3.3%.
Many insurers worry that alternative investments are too risky or overly complicated for them. Or that given the strength of the bond or equity markets, there is no need to diversify to alternatives.
The truth is that many of the alternative asset classes have historically had lower volatility than public equities. An appropriate risk-managed and comprehensive framework could offer a clear guide to diversifying into alternatives before the market cycle changes.
Even a small allocation (5% or less) to alternatives may enhance the performance and efficiency of an asset portfolio (goal of maintaining performance while potentially decreasing risk). This helps support Return on Equity, surplus growth, capacity ratios, and other key metrics.
Active vs. Passive Management
Insurance asset management is different from other types of asset management and demands active asset allocation and investment management within a strong risk framework. This requires both a deep-rooted understanding of client objectives, needs, and constraints, as well as a strategic, objectives-based, asset allocation across a diverse set of asset classes, sectors, and vehicles to enhance portfolio customization and performance. Here are six characteristics of active investment management:
- CONSIDERS THE ENTIRE BALANCE SHEET: The portfolio design should include all characteristics of the insurer: size, type, business lines, capital, financial strength ratings, growth rates, trends. Traditional methods of asset allocation may provide the same portfolio structure for two very different firms simply because the objective is the same. A well-capitalized, large crop insurer should not be managed the same as a capital-constrained, small auto insurer simply because they both have an objective of growth of surplus.
- THE ROLE OF THE PORTFOLIO IN MEETING BUSINESS OBJECTIVES: The portfolio should be structured to help optimize business objectives, not a volatility number. Clearly prioritizing all critical business objectives is critical for a successful asset allocation.
- STRATEGIC DECISION MAKING: The portfolio should be guided by a forward-looking, multi-year plan that clearly demonstrates how it will support key objectives over time. Point in time risk analyses do not tell an insurer how surplus will grow over time or at what point Net Investment Income will reach company targets.
- ALL RELEVANT ASSET CLASSES: Traditional asset allocation is dependent upon deciding which asset classes to include before completing any analysis. A stronger approach is to include all assets, then eliminate those that are inaccessible or do not provide the desired outcomes.
- CHANGING MARKET AND COMPANY DYNAMICS: Market expectations for rates, spreads, returns, correlations shift almost constantly, as do insurance company characteristics and regulatory frameworks. Using backward-looking data is not comprehensive enough. Asset allocation and portfolio management should dynamically incorporate new data.
- EFFECTIVE COMPARISONS BETWEEN OPPORTUNITIES: Insurers need to know the impact over time of adding an investment to municipal bonds vs. high yield or of public equity vs. private equity. It may seem simple to select the more conservative option each time there is a fork in the road, but one cannot select a path forward without understanding where the path leads and what long-term outcomes are likely.
Conclusion
The universe of asset classes is complex, and there are risks in every investment. At Miles Capital, we don’t sell products. Instead, we leverage our insurance expertise, asset class knowledge, top-tier manager selection, and industry partnerships to help bring our clients clear, customized solutions that help meet their business objectives.